## 第12章
```{r}
pacman::p_load(pricesensitivitymeter, tidyverse)
#コード 12-1
# install.packages("pricesensitivitymeter")
# library(pricesensitivitymeter)
# library(tidyverse)

#コード 12-2
psm_ex <- read.csv("data/psm_ex.csv", na = ".")
head(psm_ex)
#コード 12-3
output_psm <- psm_analysis(
  toocheap = "tch",
  cheap = "ch",
  expensive = "ex",
  tooexpensive = "tex",
  data = psm_ex
)

summary(output_psm)
#コード 12-4
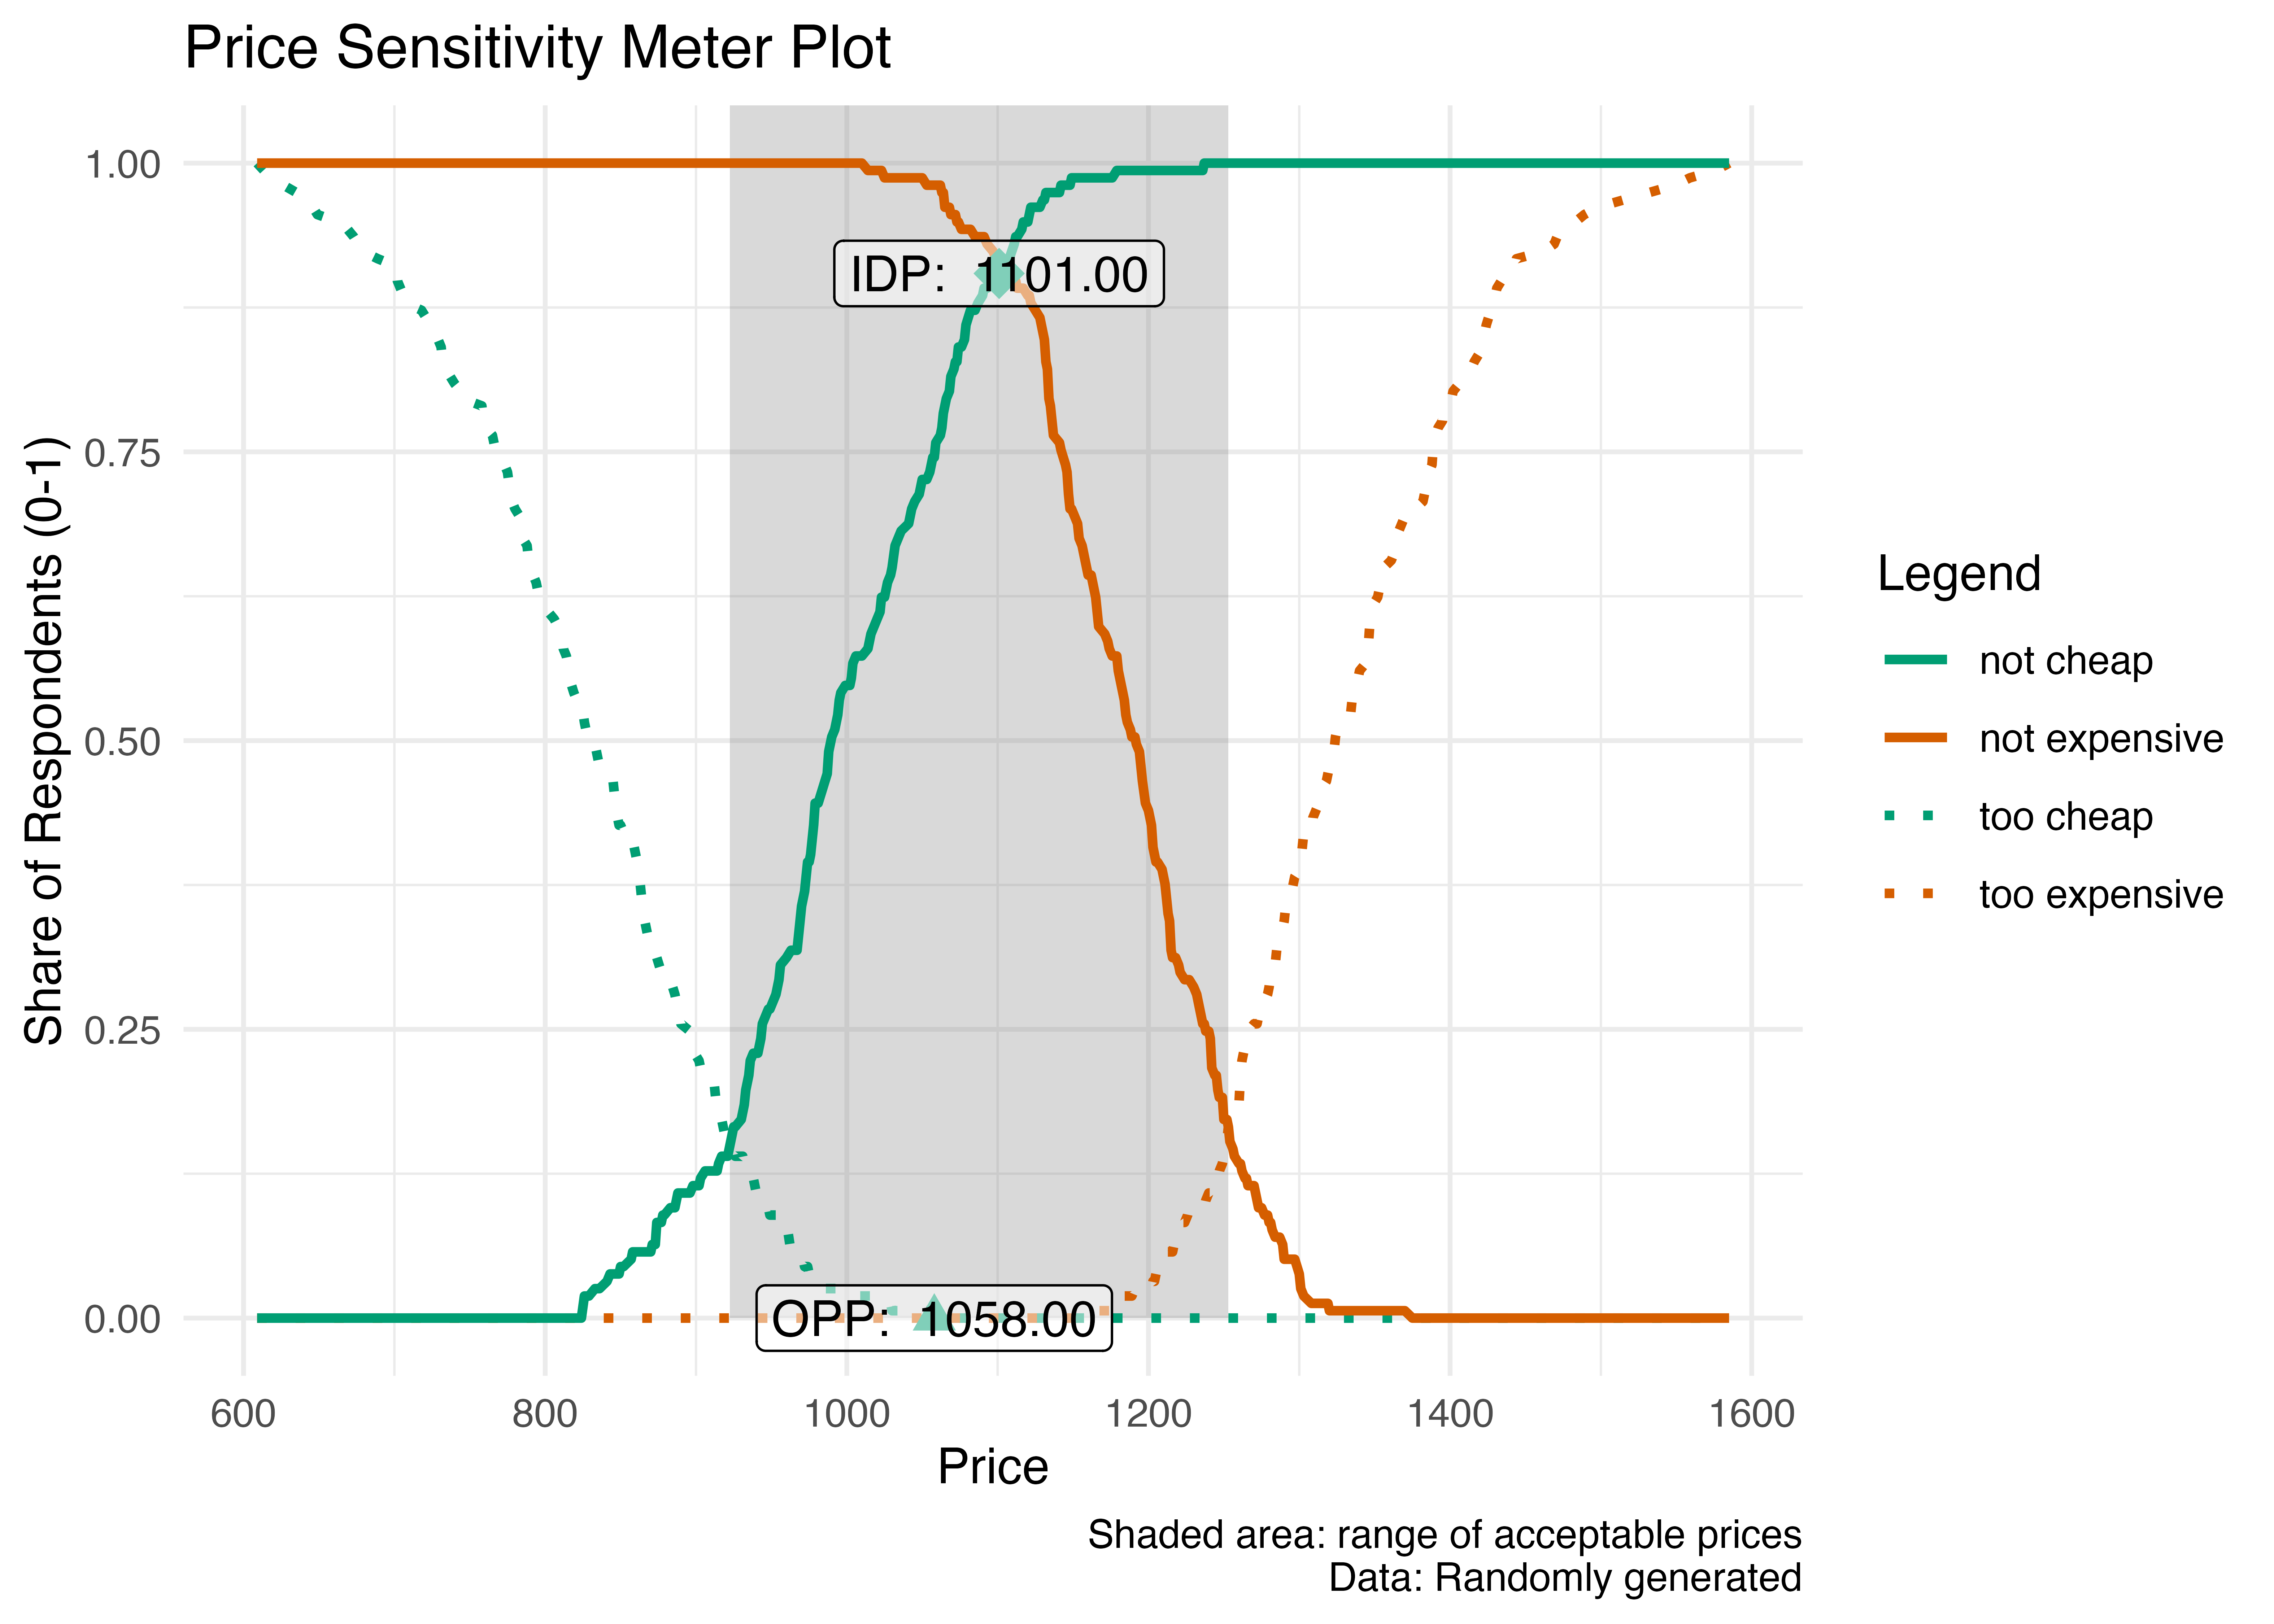
psm_plot(output_psm) +
labs(
x = "Price",
y = "Share of Respondents (0-1)",
title = "Price Sensitivity Meter Plot",
caption = "Shaded area: range of acceptable prices\nData: Randomly generated") +
theme_minimal()
```